Introduction[]
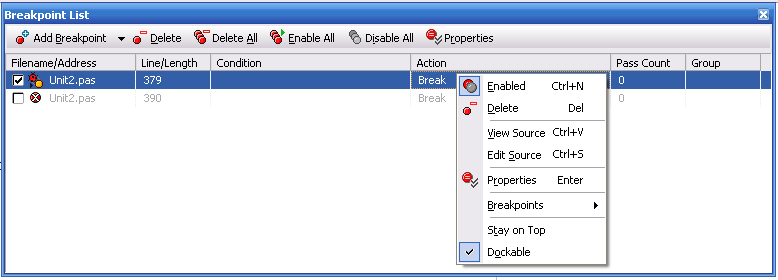
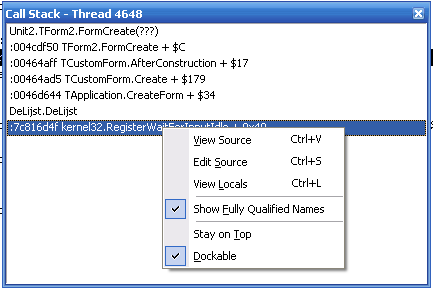
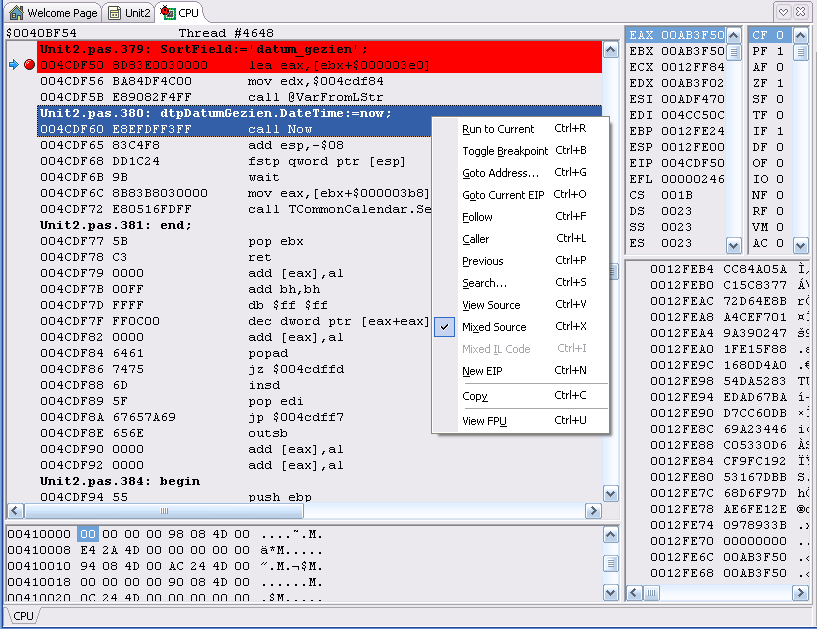
One of the things you should learn when working with the Delphi IDE is debugging an application. Along the way you will soon enough stumble upon bugs which needs debugging. You might already have thought of an alternative way to find out where that pesky bug is at and squash it. Using showmessage presenting the data you suspect is causing errors might help you with the simple bugs, but over time your applications will get more and more complex and showmessage will not be sufficient enough for tracing down your program errors. This is where Delphi's debugging tools come in.
Setting up the Debug desktop[]
You can setup the look for your debug desktop. Position any of the windows you like to use within the debug desktop and when your happy with the layout use "set debug desktop" which can be found under the menu "View->Desktops->set debug desktop" or click the set debug desktop toolbar button.
Debugging delphi source files[]
Ever wanted to debug the source files which came with Delphi? If you didn't set your properties correctly and added a breakpoint to a Delphi source file the debugger will never stop at the breakpoint you have set. You need to go to "project->options->compiler" on this tab you need to check the "use debug DCUs". After that you need to build your project again and you can run your application. From now on breakpoints also stop in Delphi source files. This also makes it possible to step through Delphi source code.
